Image reduction
The reduction of science images is the calibration with the master bias, master dark and master flat images, by this process the resulting image has only the information of the observed sky (including the earth sky background).
Operation files
In order to avoid random image artifacts like cosmic rays is really recommended to use some images of the same sky field (at least three with the same exposition time) and obtain the median or the average of the images.
For this, you could write a list file with the path of each image (same as the bias section) and indicate the keyword of the fits heads which has the information of the exposure time, writing the name of this keyword in the time keyword entry.
science/science_1.fits
science/science_2.fits
science/science_3.fits
However, you could indicate the times manually, writing AUTO in the time keyword entry and writing the times in the list file, as the following example.
science/science_1.fits  1450
science/science_2.fits  1450
science/science_3.fits  1450
image reduction
To reduct the science image put AstroCanvas in image reduction mode and write the name of the list file in the images entry. You can also select an area of the image writing the limits in the Crop image entries.
The master bias, master dark and master flat are indicated in the master bias, master dark and master flat entries respectively, you can write the name of a fits file (you should ensure that it has the same size as science images) or a number.
There is also an option to select the combination of all the images (combining images entry), this can be by the median or the average (pixel by pixel) of the images.
To obtain the reducted image, press the make image button and, after the processing, the reducted image appears in the canvas.
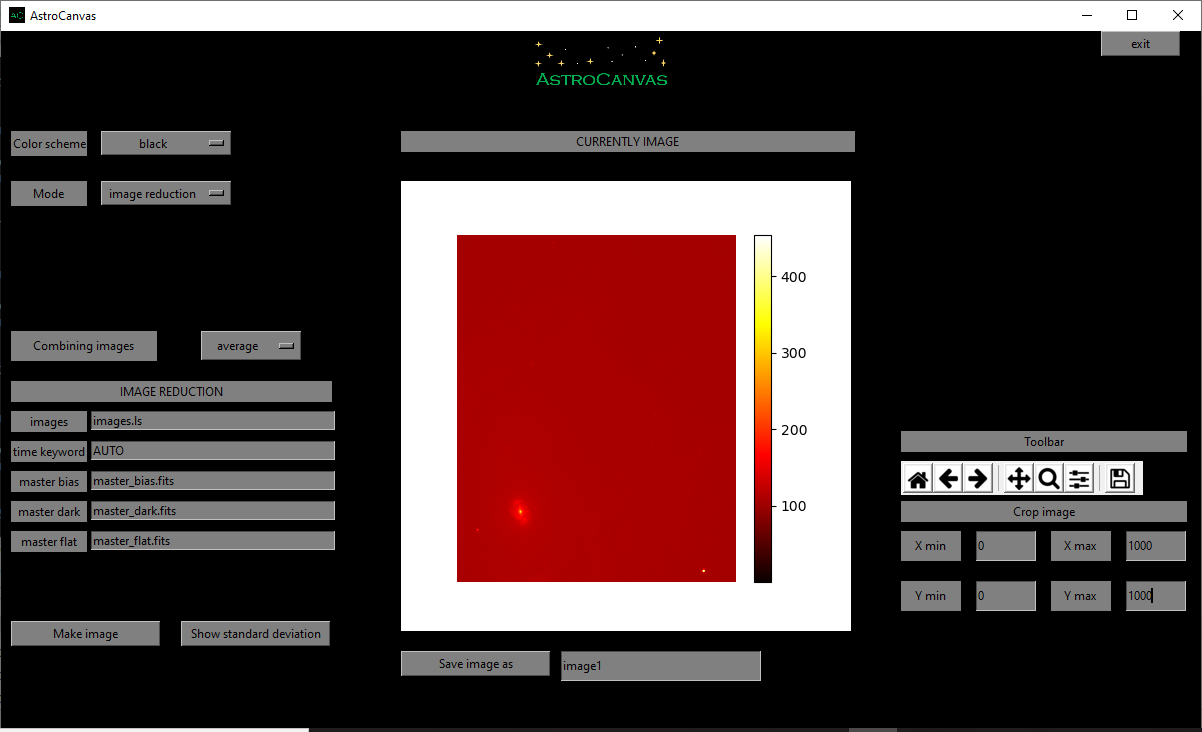
fig. 4 screenshot of Astrocanvas in image reduction mode plotting a science image.
In addition, a image with the standard deviation could be shown in the canvas with the show standard deviation button.
The Matplotlib toolbar is available in the right of the window with its basic functions.
When you make a reducted image, the terminal shows some information, the average, the standard deviation, the maximun value and the minimun value of the reducted image pixels and also its size, an example is shown below.
reducted image
--------------
average= ( 102.39164309107943 )
standard deviation= ( 12.386694342562224 )
max= ( 453.9240856874631 )
min= ( 1.14862050944999 )
size= 1250 X 1250
Finally, you can save the image writing a name and clicking on the Save image as button.